爬虫笔记之JS检测浏览器开发者工具是否打开
在某些情况下,我们需要检测当前用户是否打开了浏览器开发者工具,比如前端爬虫检测。如果检测到用户打开了控制台,就认为是潜在的爬虫用户,再通过其它策略对其进行处理。本文主要讲述几种前端 JS 检测开发者工具是否打开的方法。
一、重写 toString()
对于一些浏览器,比如 Chrome、Firefox,如果控制台输出的是对象,则保留对象的引用,每次打开开发者工具时,都会重新调用对象的 toString() 方法,并将返回结果打印到控制台(console tab)上。
因此,可以创建一个对象,重写它的 toString() 方法,然后在页面初始化时将其打印到控制台(假设控制台还未打开)。当用户打开控制台时,会再调用 toString() 方法,从而捕获用户打开控制台的行为。
示例代码
<html>
<head>
    <title>console detect test</title>
</head>
<body>
<script>
    function consoleOpenCallback(){
        alert("CONSOLE OPEN");
        return "";
    }

    !function () {
        let foo = /./;
        console.log(foo);
        foo.toString = consoleOpenCallback;
    }()
</script>
</body>
</html>
效果:
当第一次在页面上打开控制台时,会触发检测。但如果是在已经打开控制台的窗口中粘贴网址访问,或在控制台已打开的页面上刷新,则不会触发。这种方法并不通用,并且只能捕获从关闭到打开的状态转移。
二、使用 debugger(适用于规避爬虫不适合规避人为查看代码)
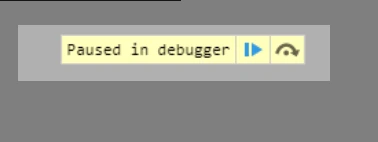
类似于代码里的断点,浏览器在打开开发者工具时(调试模式下)遇到 debugger 标签时,会暂停程序执行。此时需要用户点击 "Resume script execution" 按钮,程序才会继续执行。在暂停期间的时间差可以用来判断开发者工具是否已打开。
如果 debugger 标签处于执行状态,且暂停时间超过某个阈值,则可以判断为开发者工具已打开。
示例代码:
<html>
<head></head>
<body>
<script>
    function consoleOpenCallback() {
        alert("CONSOLE OPEN");
    }

    !function () {
        const handler = setInterval(() => {
            const before = new Date();
            debugger;
            const after = new Date();
            const cost = after.getTime() - before.getTime();
            if (cost > 100) {
                consoleOpenCallback();
                clearInterval(handler)
            }
        }, 1000)
    }();
</script>
</body>
</html>
效果:
此方法存在一个严重的缺陷,如果用户发现异常并没有点击 "Resume script execution" 按钮,而是直接退出页面,则无法检测到开发者工具的打开。此外,如果勾选了 Chrome 浏览器的 "Deactive breakpoint" 功能,debugger 标签将不再暂停,导致此方法失效。
debugger 标签的反调试功能
debugger 标签可以用来反调试,阻碍调试者的调试过程。通过设置每秒触发一次 debugger,可以让调试者疲于应付,或者增加他们覆盖掉 JavaScript 的成本。
示例代码
<html>
<head>
    <title>Anti debug</title>
</head>
<body>
<script>
    !function () {
        setInterval(() => {
            debugger;
        }, 1000);
    }();
</script>
</body>
</html>
效果:
这种方式会让调试者感到困扰,且每秒都会暂停在 debugger 标签处。
实际应用示例
一个实际的例子是某网站的 JS 检测脚本,使用了类似的反调试策略。如果开发者工具打开并尝试解析视频,网站会触发一个 debugger 标签,并在检测到开发者工具后,移除视频解析内容并显示错误提示。
破解方法
- Deactive Breakpoint:在 Chrome 中,可以设置为“Deactive breakpoint”,使
debugger标签失效。 - Fiddler:使用 Fiddler 修改网页返回内容,过滤掉
debugger标签,从而避免检测。
三、检测窗口大小
浏览器的 innerWidth 和 outerWidth 可以用来判断开发者工具是否打开。innerWidth 表示浏览器窗口的可视区域,而 outerWidth 包含了浏览器的工具栏。
window.innerWidth / window.innerHeight :可视区域的宽高,window.innerWidth包含了纵向滚动条的宽度,window.innerHeight包含了水平(横向)滚动条的宽度。
window.outerWidth / window.outerHeight:会在innerWidth和innerHeight的基础上加上工具条的宽度。
有人专门针对此写了个库:https://github.com/sindresorhus/devtools-detect
示例代码:
(function () {
    'use strict';
    var devtools = { open: false, orientation: null };
    var threshold = 160;

    var emitEvent = function (state, orientation) {
        window.dispatchEvent(new CustomEvent('devtoolschange', {
            detail: { open: state, orientation: orientation }
        }));
    };

    setInterval(function () {
        var widthThreshold = window.outerWidth - window.innerWidth > threshold;
        var heightThreshold = window.outerHeight - window.innerHeight > threshold;
        var orientation = widthThreshold ? 'vertical' : 'horizontal';

        if (!(heightThreshold && widthThreshold) &&
            ((window.Firebug && window.Firebug.chrome && window.Firebug.chrome.isInitialized) || widthThreshold || heightThreshold)) {
            if (!devtools.open || devtools.orientation !== orientation) {
                emitEvent(true, orientation);
            }
            devtools.open = true;
            devtools.orientation = orientation;
        } else {
            if (devtools.open) {
                emitEvent(false, null);
            }
            devtools.open = false;
            devtools.orientation = null;
        }
    }, 500);
})();
缺点:
- 当开发者工具是以独立窗口打开时,无法检测到。
- 可能存在浏览器兼容性问题,可去此页面进行验证:https://sindresorhus.com/devtools-detect/
四、总结
本文介绍了几种常见的检测方式,各有其优缺点:
- 重写
toString():只能捕获开发者工具从关闭到打开的状态转移,具有一定局限性。 debugger标签:在某些情况下(如勾选 "Deactive breakpoint"),检测会失效。- 检测窗口大小:在开发者工具以独立窗口打开时无法检测。
每种方法都有其适用场景,需根据实际需求选择合适的策略。
相关资料
- Find out whether Chrome console is open
- https://www.cnblogs.com/cc11001100/p/9265945.html